Hyperflex Solutions & Best Practices
From building search applications to enhancing Elastic Stack performance, our team ensures every solution is designed to deliver measurable results. Stay tuned for best practices and insights to help you make the most of your Elastic investment.
.avif)
.avif)

Elasticsearch for Government Search: Building Multilingual, OCR-Powered, and Relevance-Tuned Portals
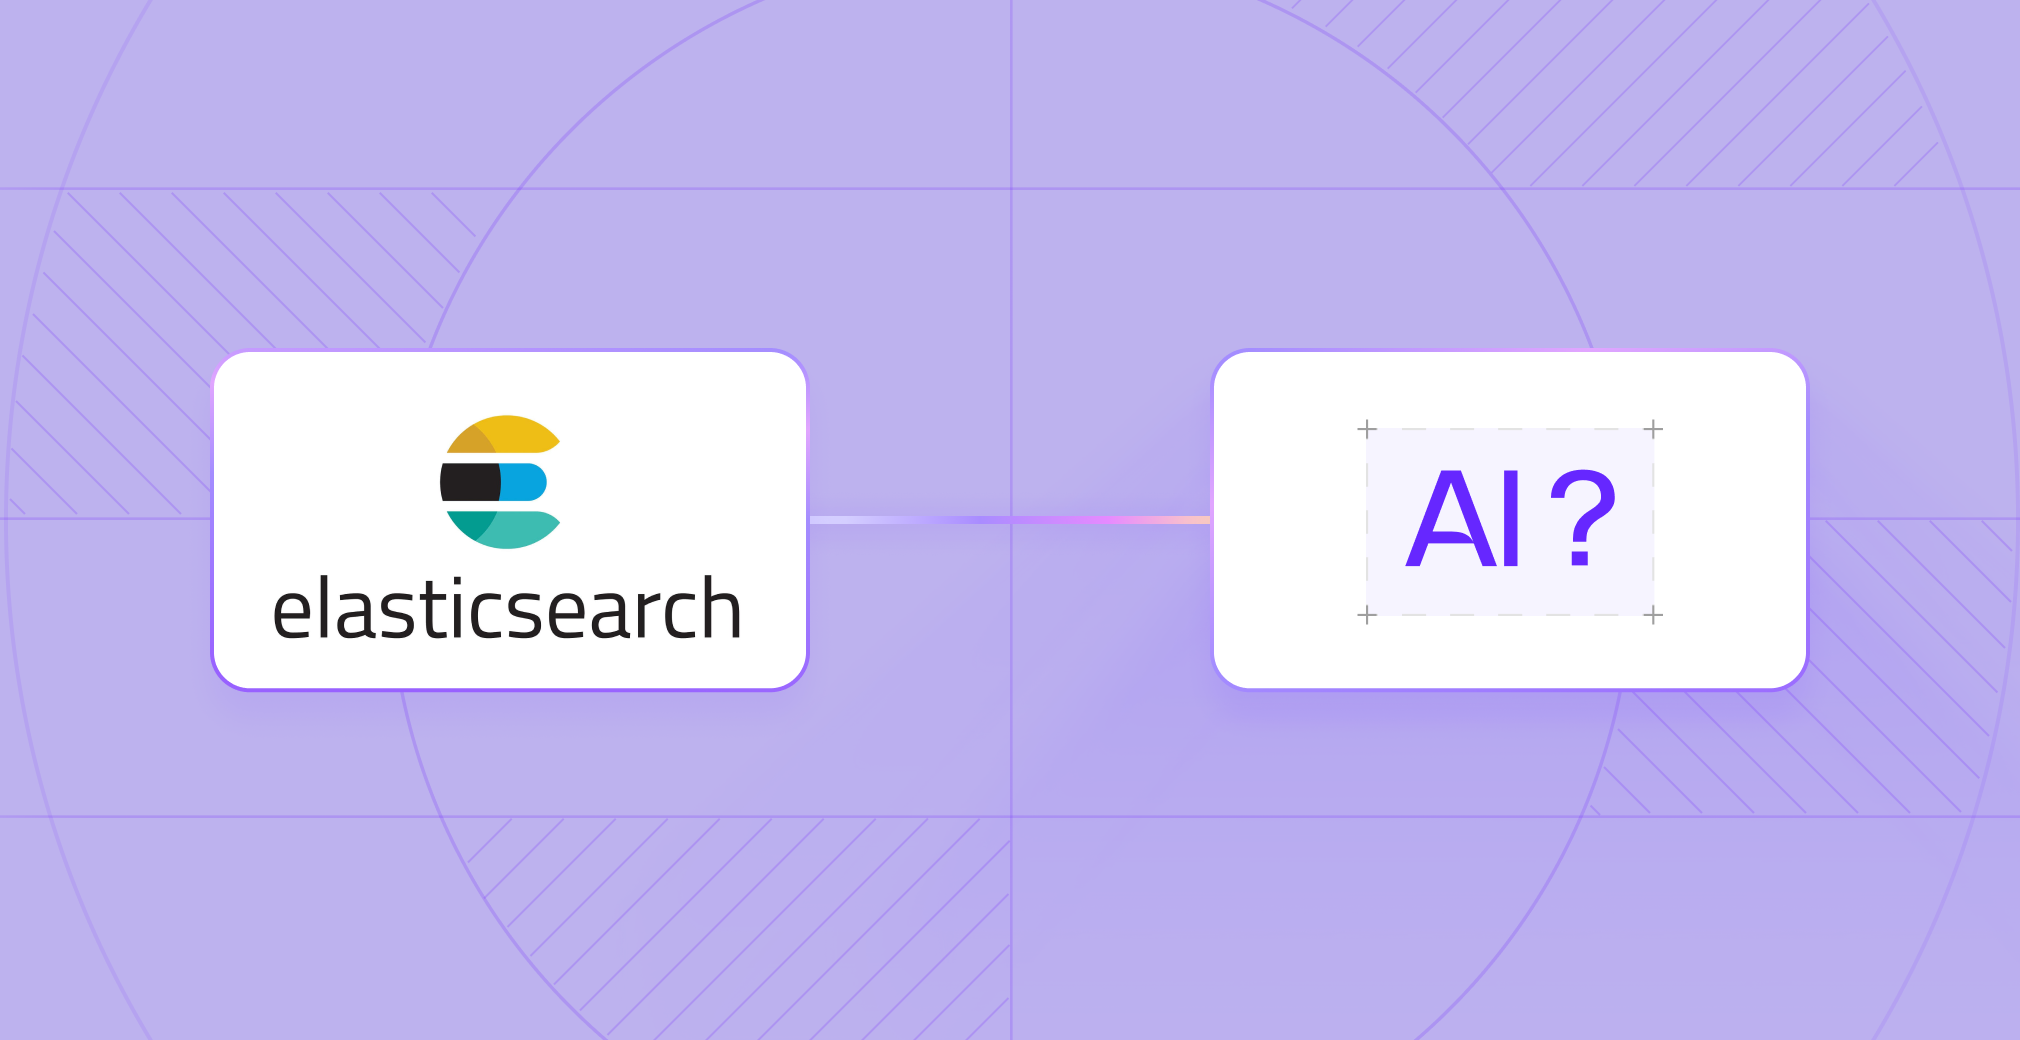
How Elasticsearch Is Evolving into an AI-Centric System
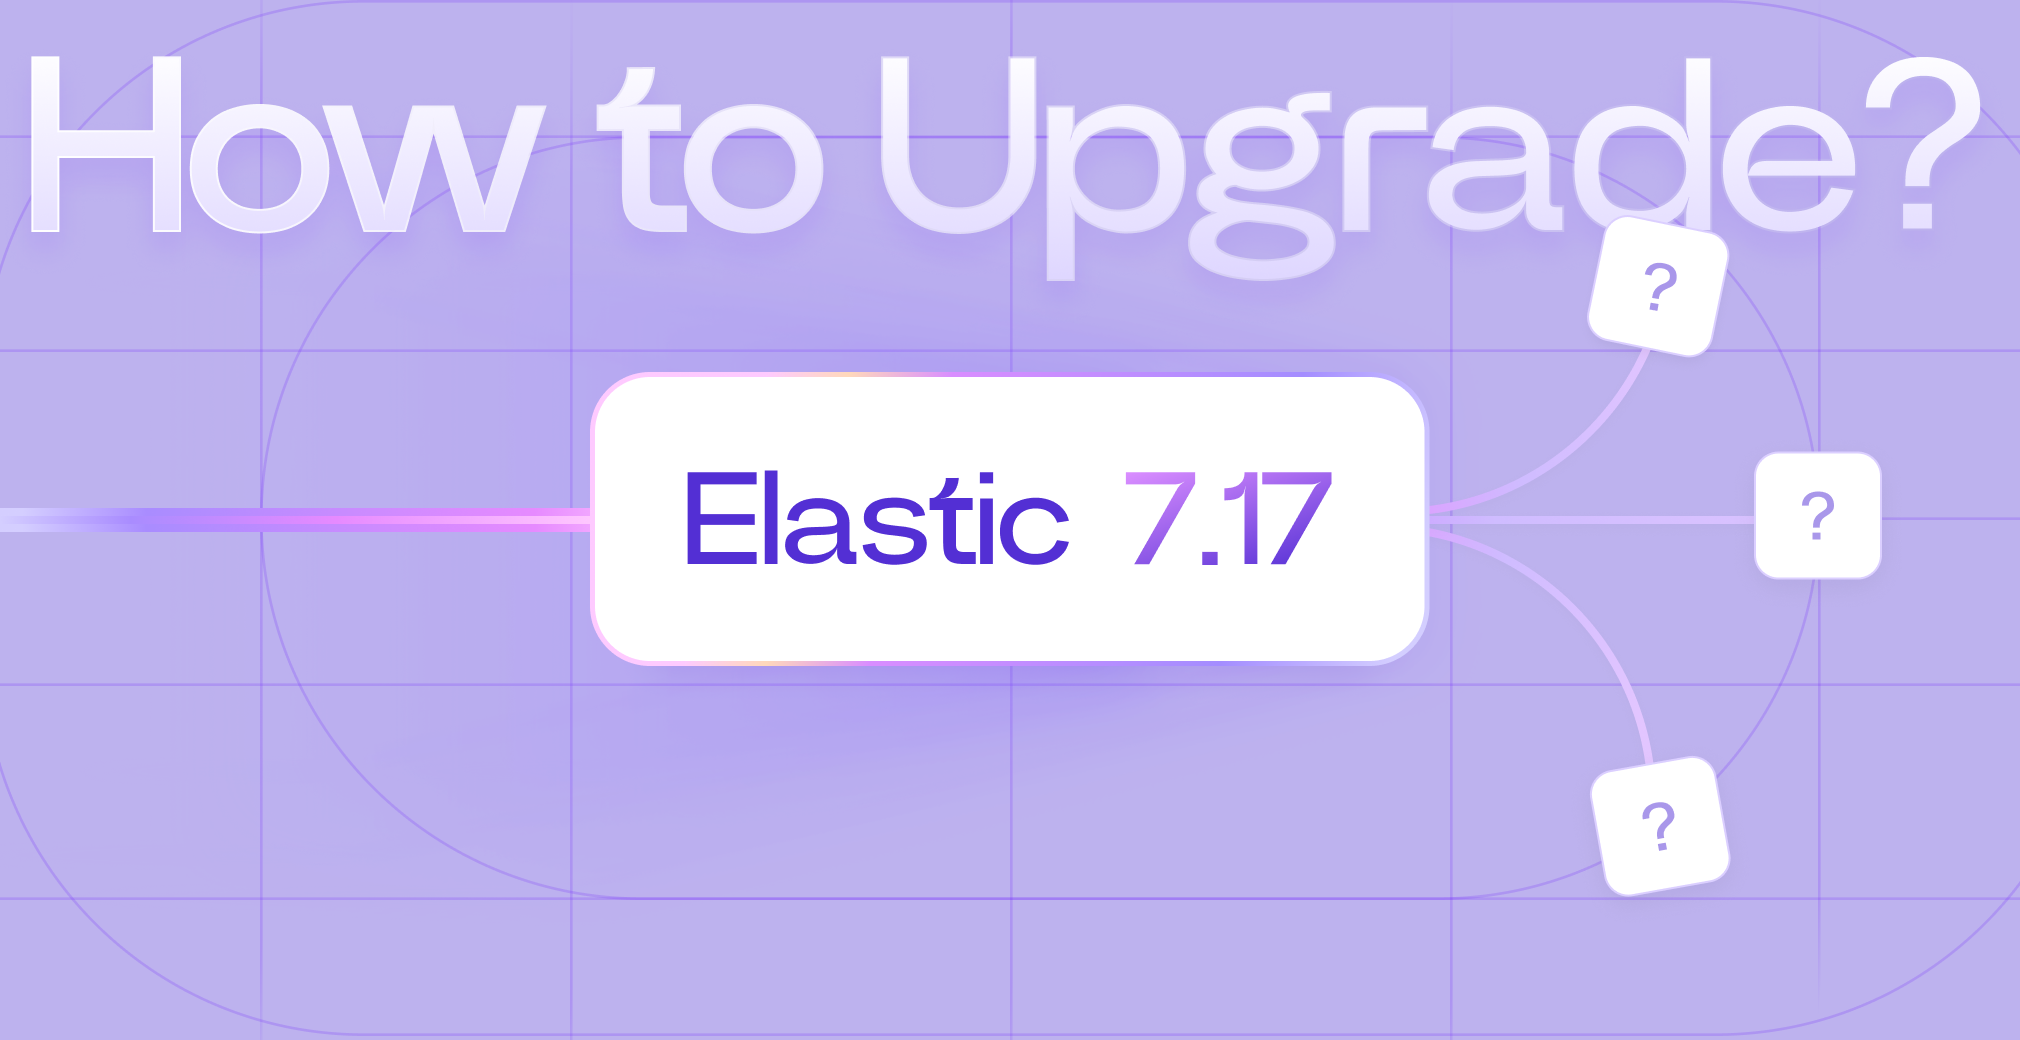
Elastic 7.17 End of Life: How Hyperflex Helps Teams Upgrade Smoothly to 9.2.2
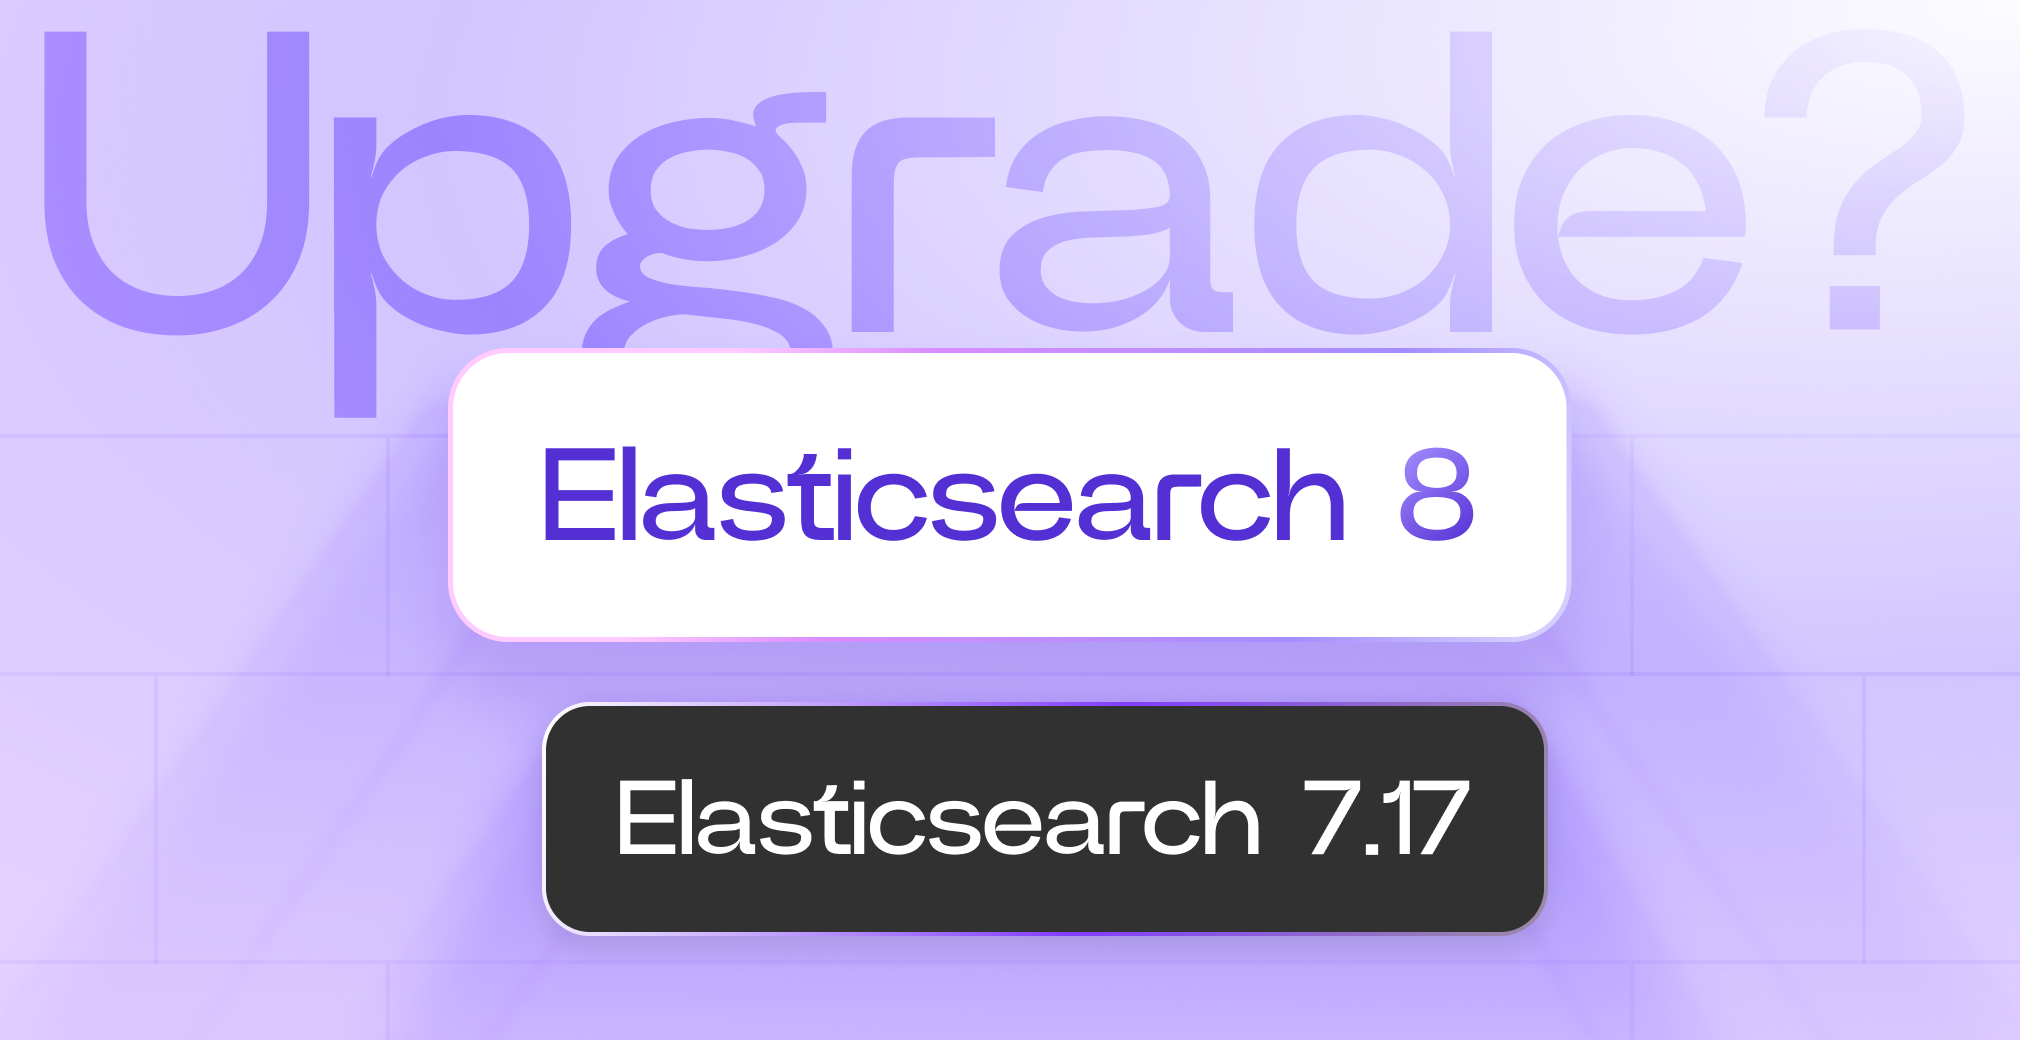
Elastic Elasticsearch Upgrade: A Practical 7.17 → 8.x Playbook (No Surprises)

Elastic Cloud vs Self-Managed: What We Recommend After 25+ Deployments
.png)
How to use Elastic's Cursor plugin safely with live production context

How to Deliver a Splunk to Elastic Migration in 30 Days
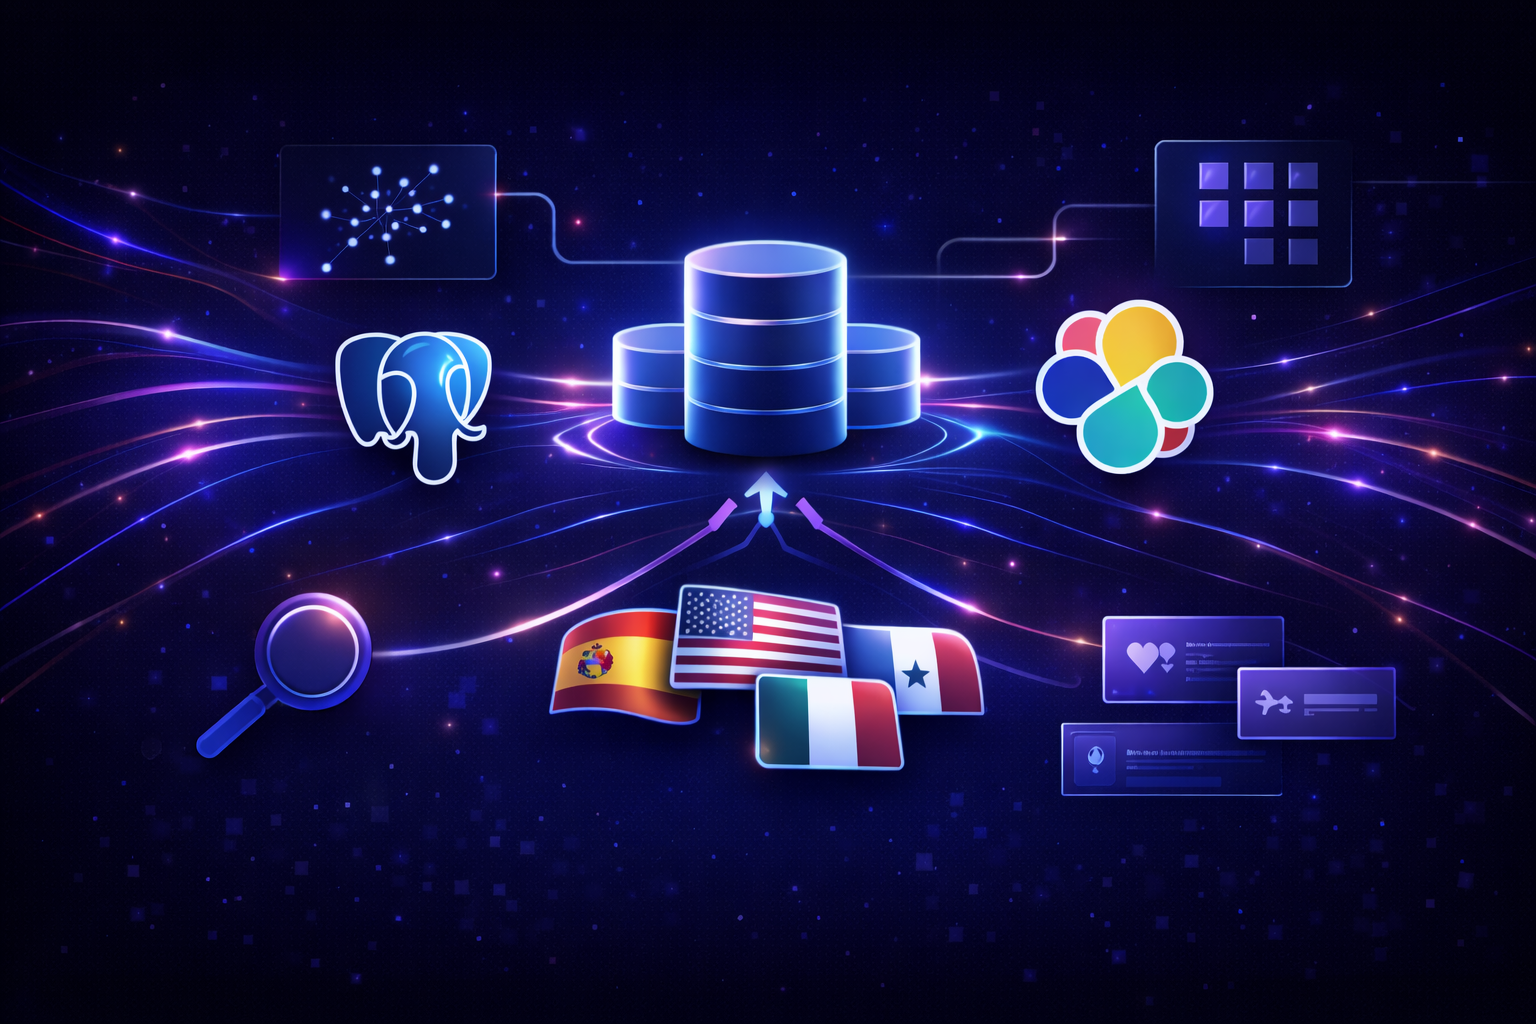
Hybrid AI Search with Elastic and Postgres: How Marketplaces Achieve Smarter, Faster, Multilingual Search

Seamless Elasticsearch Migration to ECK Operator: Architecture, Pitfalls, and Real-World Best Practices

Elastic Searchable Snapshots Explained: Warm vs Cold vs Frozen (and fm-clone-*)

Elastic + Cloudflare: What the Outage Taught Us About Real Resilience

AI-Powered Commerce Search: How Generative AI and Semantic Search Are Redefining Product Discovery for E-Commerce Giants

Why Most Companies Deploy Vector Search Wrong and How Hybrid Search in Elasticsearch Fixes It

Elastic Observability in Action: How a French Distributor Replaced Dynatrace and Built a GenAI Future

Upgrading Elasticsearch 5.7 to 9 in the Automotive Industry

How to Use Elastic Agent Fleet for Real-Time Security Monitoring (Step-by-Step)
.png)
Upgrading Elasticsearch from 6.8 to 8.x: A Real-World Modernization Blueprint for Enterprise Search & Observability

Elasticsearch Consulting New York: Global Expertise, Local Presence with Hyperflex

Why IoT Companies Need Expert Elasticsearch Consulting for Real-Time Data Validation
Frequently Asked Questions
Select the package that best fits your requirements and pay here to have a dedicated expert available within 1 hour (EST) to support you. Our team is ready to provide immediate assistance and ensure your Elastic environment is optimized and secure.
Hyperflex offers Elastic solutions across a variety of sectors, specializing in healthcare, finance, manufacturing, and cybersecurity. We provide tailored support to meet the unique needs of each industry.
We implement multiple high-level security protocols, including attribute-based access control, threat monitoring, and zero-trust architecture. Regular security audits and ongoing threat monitoring ensure that your data is protected, with a focus on both security and efficiency.
Our services include fast and effective support for deployment, optimization, troubleshooting, and ongoing maintenance of Elastic environments, ensuring that your system performs optimally according to your current cluster size.
We work closely with you to design and implement custom Elastic solutions that integrate with your existing business systems. Our approach includes continuous support that addresses specific needs as they arise and provides an avenue for additional feature implementation.
Hyperflex is dedicated exclusively to Elastic, offering specialized expertise and fast, affordable support. This focused approach ensures high-quality service tailored to your Elastic environment.
Yes, we provide training sessions that focus on the effective use and optimization of Elastic. Our training is designed to be both informative and cost-efficient, helping your team maximize their skills and system performance.
Ready to Transform Your Data Management?
Unlock the full potential of your data with Hyperflex’s Elastic solutions. Enhance your search capabilities, gain real-time insights, and ensure system reliability. Let us tailor a solution that fits your specific needs. Contact Hyperflex today and start maximizing the power of your Elastic environment.
