How to Use Elastic Agent Fleet for Real-Time Security Monitoring (Step-by-Step)
A step-by-step guide to deploying Elastic Agent with Fleet for real-time security monitoring. Learn Fleet architecture, endpoint protection with Elastic Defend, alerting, automations, and best practices from Hyperflex engineers.
Introduction
Security teams today operate in a world of continuous risk. Every endpoint, every container, every system log could hide the next threat.
That’s why Elastic Agent Fleet has become a cornerstone of modern security operations - unifying endpoint protection, log collection, and telemetry monitoring under one management plane.
Instead of manually configuring Beats on every host, Fleet lets you centrally manage hundreds of Elastic Agents from a single interface - complete with policies, integrations, and live health status.
At Hyperflex, we help enterprise and defense clients implement Elastic Security for mission-critical workloads. Our engineers optimize Fleet deployment for high-security networks, ensuring compliance, speed, and resilience.
Before You Start: Prerequisites & Requirements
Before deploying Fleet, confirm you have:
- Elastic Stack Version: 8.x or higher
- License: Basic license works, but Elastic Security requires Platinum or Enterprise
- Installed Components: Elasticsearch, Kibana, Fleet Server
- Network: Agents must reach Fleet Server on port 8220
Additional checklist:
- Admin rights on Fleet Server host
- Certificates configured (for TLS)
- Outbound access to Elasticsearch and Kibana
Fleet supports Linux, Windows, and macOS - allowing hybrid or fully on-prem coverage.
Fleet Architecture Overview
Fleet introduces a hub-and-spoke model for agent management:
- Fleet Server: The command and control node that manages agent enrollment, policies, and status.
- Elastic Agent: Deployed on endpoints to collect logs, metrics, and security data.
- Elasticsearch: The storage and analytics layer for ingested events.
- Kibana: The management and visualization interface.
Data flow overview:
- Elastic Agent collects logs and telemetry from endpoints.
- Data is sent securely to Fleet Server.
- Fleet Server forwards it to Elasticsearch.
- Kibana displays dashboards, alerts, and rule-based detections.
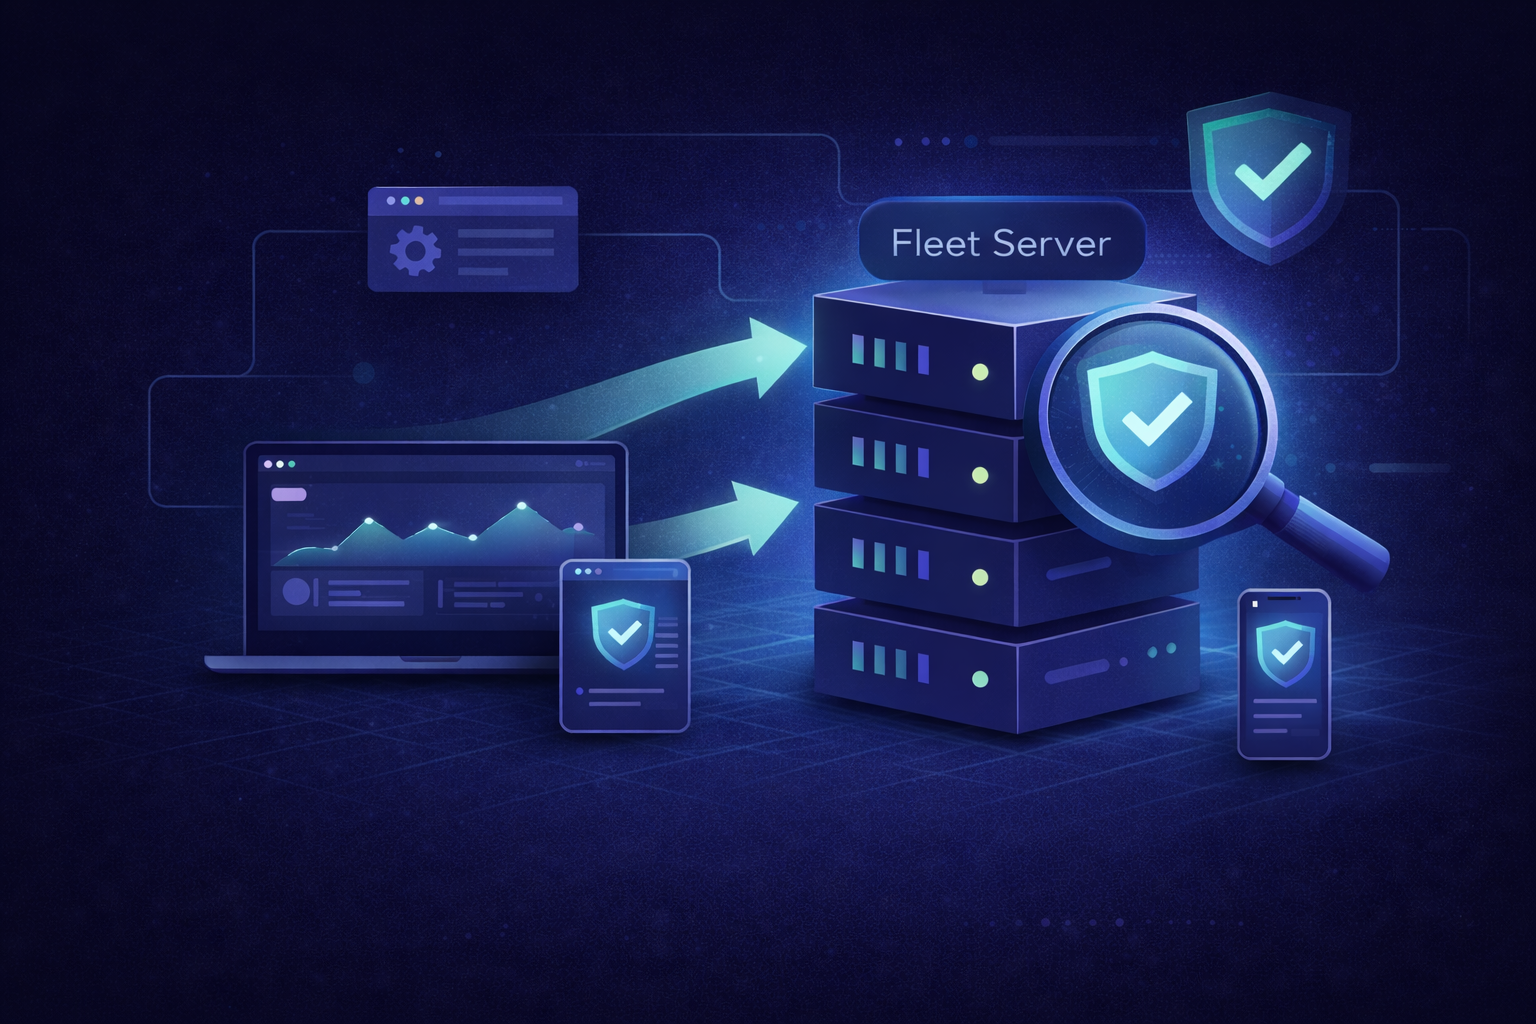
💡 Think of Fleet Server as your mission control - coordinating agents, updates, and configurations across your entire organization.
Step 1: Install and Enroll Elastic Agent
Download and Extract Agent
Enroll the Agent
In Kibana, generate an enrollment token:
Fleet → Agents → Enrollment Tokens → Create Token
Then run:
After successful enrollment, the agent appears in Kibana → Fleet → Agents.
Step 2: Connect Agents to Fleet Server
Fleet Server centralizes policy management and requires secure communication with Elasticsearch.
Run the following on your Fleet Server host:
Verify the service:
sudo systemctl status elastic-agent
Output should include Active: active (running).
Step 3: Add Security Integrations
Navigate to Kibana → Integrations and install key packages:
- Elastic Defend — Endpoint protection and detection
- Auditd Logs — Linux audit framework
- Windows Security Logs — Event logs from Windows hosts
Create a new Agent Policy (e.g., security-policy-prod) and assign the integrations.
Sample YAML Policy (elastic-agent.yml)
This policy applies preventive protection on Windows and detection on Linux for controlled coverage.
Step 4: Monitor in Kibana Security App
Open Kibana → Security → Dashboards to access real-time views.
You’ll see:
- Endpoint Alerts — Active detections
- Host Overview — CPU, process, and memory health
- Detection Rules — Elastic’s prebuilt rule engine
Example query to view alerts:
event.module : "endpoint" and event.kind : "alert"
This enables fast triage and validation across endpoints.
💡 Hyperflex Insight
Hyperflex helps enterprises deploy and secure Elastic Agent Fleets at scale.
From architecture design to certificate automation, our consulting team ensures continuous security visibility and uptime for regulated industries.
Step 5: Create Alerts and Automations
1. Use Prebuilt Rules
Go to Security → Rules → Load Elastic Prebuilt Rules
Enable sets such as:
- Privilege Escalation
- Malware Prevention
Persistence Mechanisms
2. Custom Rule Example
Alert when PowerShell spawns under a suspicious parent process:
process.parent.name : "winword.exe" and process.name : "powershell.exe"
Add email or webhook actions directly from the rule builder.
Elastic Defend Deep Dive
Elastic Defend replaces multiple endpoint agents with a single unified integration.
Key capabilities:
- Malware Prevention: Blocks known threats via built-in ML models.
- Behavioral Detection: Tracks process ancestry and suspicious activity.
- Memory Threat Protection: Identifies in-memory exploits and injections.
- Ransomware Protection: Prevents file encryption events in real time.
Configuration tip:
To enable ransomware protection via YAML, add:
Elastic Defend events flow into the logs-endpoint.alerts-* index, visible under Security → Alerts.
Automating Incident Response via Webhook
For modern SOCs, automation shortens mean time to respond (MTTR). Elastic Security allows native webhook integrations to send alerts to Slack, Teams, or SOAR systems.
Example: Webhook Action
- Go to Stack Management → Rules and Connectors → Create Connector
- Choose Webhook
Provide endpoint details:
- Attach this connector to your Security rules.
Now, every time a detection fires, your webhook can automatically notify an analyst or trigger a remediation workflow.
Best Practices for Secure Fleet Management
- TLS First: Always use HTTPS for agent–server communication.
- Token Hygiene: Rotate enrollment tokens monthly.
- Role-Based Policies: Separate production, staging, and sandbox fleets.
- Monitor Fleet Health: Use Kibana → Fleet → Agents → Status for uptime metrics.
- Upgrade Gradually: Test Fleet and Elastic Defend updates on non-prod hosts first.
Central Dashboards: Manage security KPIs (alert volume, response time) in Kibana.
Troubleshooting Common Issues
.png)
Final Takeaway
Elastic Agent Fleet isn’t just about convenience - it’s a shift toward centralized, real-time defense. By bringing endpoint data, rules, and automation together, security teams can act faster and reduce blind spots across complex infrastructures.
For on-prem deployments, Fleet is the control tower that connects detection to response.
But to achieve true reliability, you need proper architecture, security hardening, and scaling strategy - areas where Hyperflex’s Elastic Consulting Services excel.
Hyperflex helps teams scale Elastic fast - with confidence.
From on-prem to hybrid cloud, we deliver optimized Elastic Security environments built for performance and compliance.
Contact us at marketing@hyperflex.co to explore how we can support your Elastic journey.
Written by Vishal Rathod, Senior Elastic Engineer at Hyperflex
